views
We explored how to log or examine canvas application telemetry in Azure Application Insights in my previous post, “Application Insights And Telemetry For The Canvas App.” Now we’ll go through how to use PowerApps Monitor and Application Insights to view logs.
The logs for PowerApps can be examined in PowerApps Monitor or Azure Application Insights (App Insights).
Monitor PowerApps
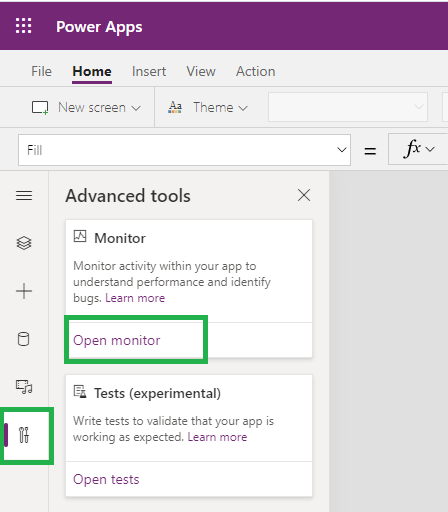
We can track events, custom logs, and any user behaviour using the built-in PowerApps monitor. This tool can be used for app development as well as publication. To accomplish this,
- Go to the PowerApps page.
- Activate any app
- On the left navigation menu, select “Advanced Tools.

- This launches a new browser window, and monitoring begins immediately. This contains things like User Action, Function, and Network, among others.

- To see more information, click on any row.
- In the case of a published app,
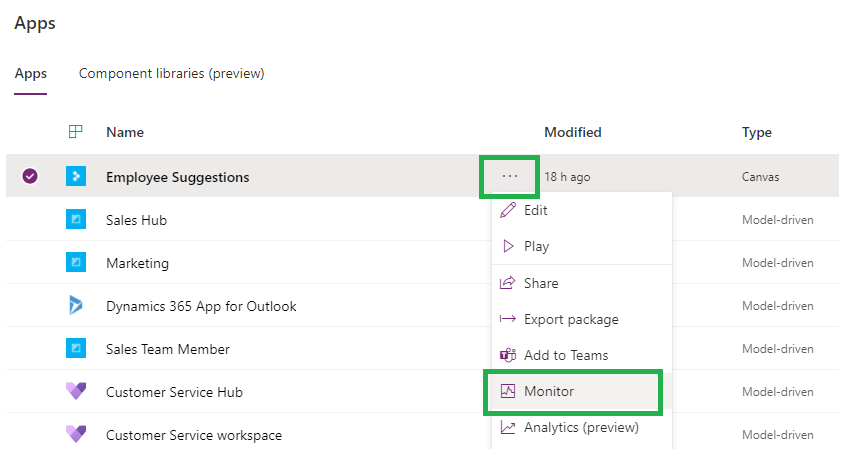
- Select Apps from the left pane.
- Select Monitor from the menu after selecting an app from the list.
- You can also pick More Commands (…) and then Monitor.

- The Microsoft article about debugging can be found here. debugging
We log in different ways in different applications. We use the Trace feature in the Canvas app.
Canvas App’s Trace Function
Along with the built-in event tracing, the Trace expression can be used to provide additional information (Custom logging).
Syntax
Message – This field is required. The information to be tracked (Custom Logging)
Optional: trace severity In Application Insights, the severity level of the Trace. Information, Warning, or Error are the available options.
Custom record — This is an optional field. A record that will be saved in Application Insights and contains custom data.
JSON formatted custom record containing any custom data or logging information.
Example
- “Contacts Gallery Loaded”,TraceSeverity.Information) Trace(“Contacts Gallery Loaded”,TraceSeverity.Information)
- Trace(“Contacts Gallery Loaded”,TraceSeverity.Information, “Contacts Gallery Loaded”) Control: “OnStart,” Screen: App.ActiveScreen.Name)
- Trace(“Contacts Gallery Loaded”,TraceSeverity.Error, “Contacts Gallery Loaded”) Control: “Save Data,” Screen: App.ActiveScreen.Name)
In Application Insights, check at the logs
When the app insights are linked to a PowerApps Canvas Screen, telemetry like Screen Views, Duration, Custom Events, and Errors may be captured. This telemetry, if executed properly, can help you learn how people interact with the software.
Launch the app and perform some steps so that the system can collect data. App Insights now generates new events. These events will appear in the session information, or you can search them directly from the Logs.
We can utilise Azure Application Insights to construct an alert that will automatically tell the user or admin if errors are logged or if the number of errors in the app has suddenly increased.
- Go to https://portal.azure.com to get started.
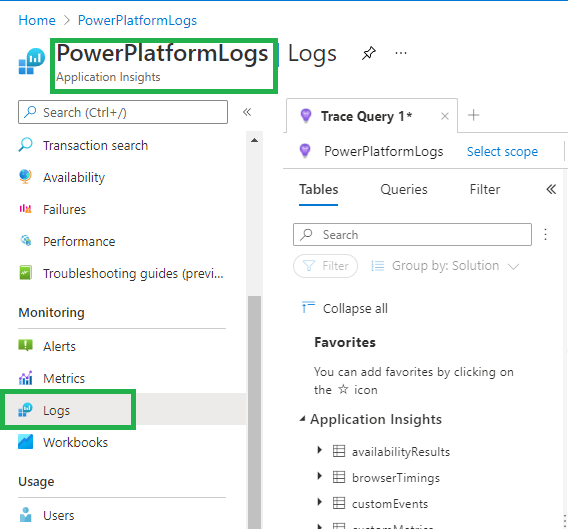
- Open the App Insights we made and linked to the Canvas app.
- On the left navigation, select “Logs.

- Log queries are extremely versatile, allowing us to combine several databases, aggregate massive volumes of data, and execute complicated actions.
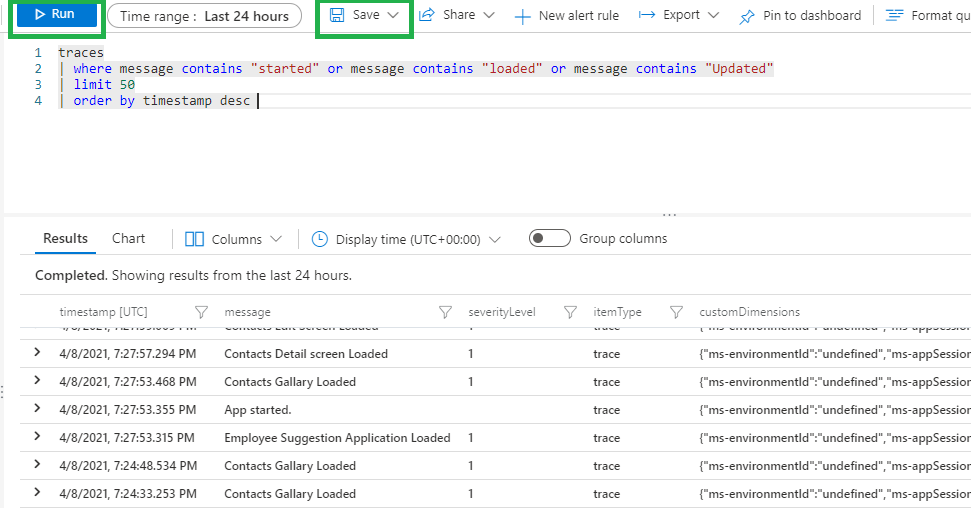
- Here’s my request for trace logs:
- An example of a query trace
where message contains “started,” “loaded,” or “Updated” | limit 50 | sort by timestamp desc
8.We can save the query for later use if we run it.

- For in-depth examination, we can create a Power BI report.
I hope this information is useful to you. Good luck with your development!


